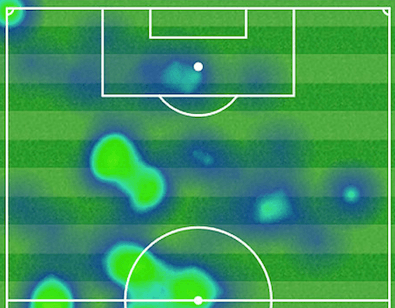
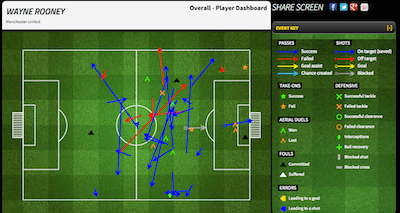
I don’t have a problem with statistics in football. I quite like them. I don’t believe that they answer everything. I’m yet to find the statistic that measures how intensely a player will chase a loose ball when his team is losing heavily, nor have I located a metric for the psychological impact of a well concealed knee in the kidneys at a set-piece. But as part of a balanced diet, alongside research, observation and reflection, I happily acknowledge the important role of statistics in the modern game. But heat maps? No. I’m not having heat maps.
Of all the many useful developments in football analytics, it is the heat maps, the stupid, facile, pointless heat maps, that have made it big. They’re even on Match of the Day now and that show used to be the last bastion of resistance to this sort of thing. There was a time when Mark Lawrenson would have ripped that shit off the wall rather than legitimise it with earnest discussion. Where did all the heroes go?
What do heat maps do? They give a vague impression of where a player went during the match. Well, I can get a vague impression of where a player went during a match by watching the game over the top of a newspaper. Even if I missed it, I can be fairly sure that your heat map will tell me that the defenders splodged around the penalty area, the midfielders in the middle and the attackers up front.
What’s that? One midfielder has indistinct splodges on the right hand side of his heat map and you think that this is indicative of something? You’re right, it is. It’s indicative that he made some kind of impact on the right. But what kind of impact did he make? Don’t expect your precious heat map to tell you. He might have been covering for a team-mate for 10 minutes while he received treatment on the sidelines. He might have been shifted by his manager. He might have been struck on the head and was wandering about in a daze. There is nothing, absolutely nothing, in a heat map that can explain anything. They are ambiguous, they are dull and they are basically useless.
If you had Four Four Two’s Opta powered Statzone, you could dissect that player’s performance. You could get a timeframe for his touches in that zone and find out if he drifted there occasionally or if he was there for an intense, but limited period of time. With a couple of clicks, you could find out how often he’d passed the ball, where he had passed it, how many interceptions he had made, how many aerial duels he had won. There is a wealth of information there.
If you had WhoScored’s app, you could look at that players performances over recent history, you could check out where they’ve played in the past, you could find out their characteristics. These are all useful things. With a heat map, what have you got? You’ve got a Global Hypercolour t-shirt as worn by Tony Blair at the Labour Party Conference in 2000. And no-one wants that.
Heat maps are like Dan Brown books; the mainstream greedily laps up the mediocrity while all the better stuff in the book shop goes unnoticed. Heat maps are like a dystopian vision of the 1990s where Northern Uproar play Knebworth and sell 10m albums while Radiohead cater to small rooms of bored students in Oxfordshire and Oasis do wedding receptions in Macclesfield.
Statistics are good. Analytics are good. Thinking about stuff is good. But heat maps? Heat maps are just bollocks.
Do you like heat maps? Are you willing to defend them in public? Would you also like to defend Dan Brown’s clumsy exposition? We bet you would. You’re disgusting. Write to us now on [email protected]


